Mean-Reversion with CooldownThis strategy requires no indicators or fundamental analysis. It is designed for longer-term positions and works especially well on unleveraged instruments with strong long-term upward trends, such as precious metals. Feel free to experiment with different timeframes — I’ve found that 1-hour charts work particularly well for cryptocurrencies.
The idea is to filter out ongoing bear phases as effectively as possible and capitalize on long-term bull runs.
The script implements an idea that came to me in a state of complete sleep deprivation: open a random long position with a fixed take-profit (TP) and a tight stop-loss (SL).
If the TP is hit — great, we simply try again.
If the SL is triggered — too bad, we pause for a while and then try again.
## Cooldown (Waiting) Mechanism
The waiting mechanism is simple: the more consecutive SL hits we get, the longer we wait before opening the next trade. The waiting time is measured in closed candles, and thus depends on the timeframe you are using.
## Two cooldown calculation modes are currently supported:
### 1. FIBONACCI
The cooldown follows the Fibonacci sequence, based on the number of consecutive losses:
1st loss → wait 1 bar
2nd loss → wait 1 bar
3rd loss → wait 2 or 3 bars (depending on definition)
4th loss → wait 3 or 5 bars
etc.
### 2. POWER OF TWO
The cooldown increases exponentially:
1st loss → wait 2 bars
2nd loss → wait 4 bars
3rd loss → wait 8 bars
4th loss → wait 16 bars
and so on, using the formula 2ⁿ.
## Configurable Parameters
### Cooldown Pause Calculation
The settings allow you to define the SL and TP as percentages of the position value.
The "Cooldown Pause Calculation" option determines how the next cooldown duration is computed after a losing trade.
The system keeps track of how many consecutive losses have occurred since the last profitable trade. That counter is then used to compute how many bars we must wait before opening the next position.
### Maximum Cooldown
The "Max Cooldown Candles" setting defines the maximum number of bars we are allowed to wait before placing a new trade. This prevents the strategy from “locking itself out” for too long and mitigates the fear of missing out (FOMO).
Once the cooldown duration reaches this maximum, the system essentially wraps around and starts the progression again. In the script, this is handled using a simple modulo operation based on the chosen maximum.
Cerca negli script per "the script"

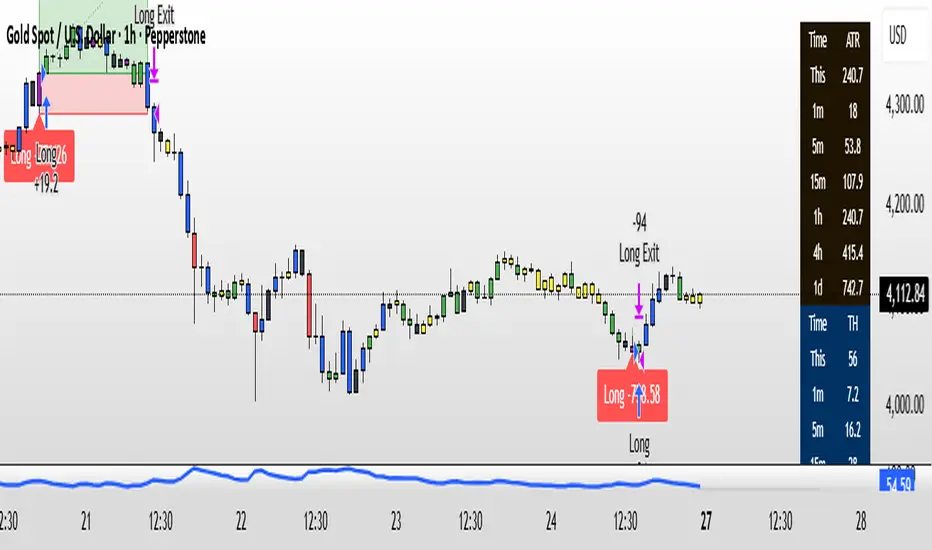
Dynamic Ratchet Trend Strategy [VIX Filter]Overview This strategy is a long-only trend-following system designed to capture major market moves while strictly managing downside risk through a state-machine based "Ratchet" exit logic. It incorporates a volatility filter using the CBOE VIX index to stay out of (or exit) the market during high-stress environments.
Key Features
1. Multi-Condition Entries The strategy looks for momentum shifts and trend breakouts using four Simple Moving Averages (25, 50, 100, 200).
Momentum Cross: SMA 25 crossover above SMA 50.
Trend Breakouts: A specific "3-Bar Breakout" logic above the SMA 50, 100, or 200. This requires the price to hold above the SMA for 3 consecutive bars after being below it, reducing false signals compared to simple closes.
2. VIX Volatility Filter Before entering any trade, the script checks the CBOE:VIX.
Filter: If VIX is above the threshold (default 32), new entries are blocked.
Panic Exit: If you are in a position and the VIX spikes above the threshold, the strategy executes an immediate "Panic Exit" to preserve capital during market crashes.
3. The "Ratchet" Exit System (3 Stages) Unlike a standard trailing stop, this strategy uses a 3-stage dynamic exit mechanism that tightens as profits grow:
Stage 0 (Initial Risk): Standard percentage-based Stop Loss from the entry price.
Stage 1 (The Lock-In): Triggered when profit hits 10% (configurable).
Unique Logic: Instead of trailing from the highest high, the stop is calculated based on the price at the exact moment this stage was triggered. It "steps up" once and holds, securing the initial move without being prematurely stopped out by normal volatility.
Stage 2 (Trailing Mode): Triggered when profit hits 15% (configurable).
The strategy switches to a classic Trailing Stop, following the percentage distance from the Highest High.
4. Emergency Backup A "Dead Cross" (SMA 25 crossing under SMA 50) acts as a final fail-safe to close positions if the trend reverses completely before hitting a stop.
Settings & Inputs
SMAs: Customize the lengths for all four moving averages.
VIX Filter: Toggle the filter on/off and set the panic threshold.
Exit Logic: Fully customizable percentages for Initial SL, Stage 1 Trigger/Distance, and Stage 2 Trigger/Trailing Distance.
Disclaimer This script is for educational purposes only. Past performance is not indicative of future results. Always manage your risk appropriately.

Best Entry Swing MASTER v3 PUBLIC (S.S)Strategy Description (English)
Best Entry Swing MASTER v3 – Quality Mode
The Best Entry Swing MASTER v3 is a structured swing trading and trend-following strategy designed to identify high-probability long and short entries during directional markets.
It combines three core setup types commonly used by momentum and breakout traders:
Breakout (BO)
Pullback Reversal (PB)
Volatility Contraction Pattern (VCP)
The strategy applies multiple layers of confirmation, including multi-EMA trend structure, volatility contraction, volume filters, and an optional market regime filter.
It is suitable for swing trading on higher timeframes (4H, Daily), as well as medium-term trend continuation setups.
Core Concepts
1. Trend Structure
A trend is considered valid when:
Uptrend: Price > EMA20 > EMA50 > EMA100
Downtrend: Price < EMA20 < EMA50 < EMA100
In addition, a simple but effective trend-strength metric is calculated using the percentage spread between EMA20 and EMA100.
This helps avoid signals during sideways or low-volatility environments.
2. Market Regime Filter
The market environment is determined using a higher timeframe benchmark (default: SPY on Daily).
Only long trades are allowed in bullish market conditions
Only short trades in bearish conditions
This significantly reduces false signals in counter-trend conditions.
Entry Logic
Breakout (BO)
A long breakout triggers when:
Price closes above the highest high of the lookback period
Volume exceeds its 20-period average
Trend and market regime confirm
(Optional A+ mode): true volatility contraction is required
Similar logic applies for short breakdowns.
Pullback (PB)
A pullback entry triggers after:
At least two corrective candles
A strong reversal candle (close above previous high for long)
Volume confirmation
Price interacts with EMA20
This structure models classical trend-reentry conditions.
Volatility Contraction Pattern (VCP)
A VCP entry triggers when:
True range contracts over multiple bars
Price holds near the breakout zone
Volume contracts
Trend and market regime are aligned
This setup aims to capture explosive continuation moves.
Quality Modes
The strategy offers two modes:
Balanced Mode
Moderate signal frequency
Broader trend-strength allowance
Suitable for more active traders
A+ Only Mode
Strict confirmation requirements
Only high-quality setups with multiple confluences
Designed to avoid low-probability trades entirely
Risk Management
Risk is managed using an ATR-based stop and target:
Long SL = Close − ATR × 1.5
Long TP = Close + ATR × 3
(Equivalent logic for short positions)
This provides a balanced reward-to-risk profile and avoids overly tight stops.
Early Entry Signals (Optional)
The script offers optional “Early Entry” markers that highlight when a setup is forming but not yet confirmed.
These are not entry signals and are disabled by default for public use.
Intended Use
This strategy is designed for:
Swing trading
Momentum continuation
Trend-following
Multi-day to multi-week trades
It performs best on:
4H
Daily
High-liquidity equities, indices, and futures
Disclaimer
This script is intended for educational and research purposes.
Past performance does not guarantee future results.
Always backtest thoroughly and use appropriate risk management.

Structure Break Out + rsi divergence + alma SIMPLIFIED OBJECTIVE (dyor, nfa, test different assets and diff TF)
The goal of this script is to act as a Reversal Sniper. Most traders lose money by trying to guess the top or bottom of a market too early. This strategy solves that by waiting for two specific events to happen together:
First, a hidden shift in momentum (RSI Divergence).
Second, a confirmed change in price direction (Crossing the ALMA 20 Blue Line).
This ensures you only enter a trade when the market has confirmed it is ready to reverse.
TRADING RULES
BUY SIGNAL (Long Position)
Step 1: Look for a GREEN DIV label below the candles. This warns you that sellers are exhausted.
Step 2: Wait for a GREEN TRIANGLE with the text GO. This confirms the price has crossed above the Blue Line.
Step 3: Enter the Buy trade immediately when the candle with the GO signal closes.
SELL SIGNAL (Short Position)
Step 1: Look for a RED DIV label above the candles. This warns you that buyers are exhausted.
Step 2: Wait for a RED TRIANGLE with the text GO. This confirms the price has crossed below the Blue Line.
Step 3: Enter the Sell trade immediately when the candle with the GO signal closes.
EXIT RULES (How to Close the Trade)
The script draws lines on the chart to help you manage the trade.
Scenario A: The Perfect Win (Target Hit)
If price hits the Green Line, the trade is closed automatically for a profit. This is your Risk-Reward Target.
Scenario B: The Trend Change (Reversal)
If the price turns around and crosses the Blue Line in the wrong direction, close the trade immediately. Do not wait for the stop loss. This protects your profits or keeps losses small.
Scenario C: The Safety Net (Stop Loss)
If price hits the Red Line, the trade is closed for a loss. This is your safety guard to prevent a small loss from becoming a big one.
IMPORTANT NOTES
Never trade a DIV label without a GO signal. The DIV is just a warning; the GO is the trigger.
- This strategy works best on 15-Minute and 1-Hour timeframes.
- If t
he Blue Line is flat, be careful, as the market may be ranging. Ideally, you want to see the Blue Line angling up or down.

Third eye • StrategyThird eye • Strategy – User Guide
1. Idea & Concept
Third eye • Strategy combines three things into one system:
Ichimoku Cloud – to define market regime and support/resistance.
Moving Average (trend filter) – to trade only in the dominant direction.
CCI (Commodity Channel Index) – to generate precise entry signals on momentum breakouts.
The script is a strategy, not an indicator: it can backtest entries, exits, SL, TP and BreakEven logic automatically.
2. Indicators Used
2.1 Ichimoku
Standard Ichimoku settings (by default 9/26/52/26) are used:
Conversion Line (Tenkan-sen)
Base Line (Kijun-sen)
Leading Span A & B (Kumo Cloud)
Lagging Span is calculated but hidden from the chart (for visual simplicity).
From the cloud we derive:
kumoTop – top of the cloud under current price.
kumoBottom – bottom of the cloud under current price.
Flags:
is_above_kumo – price above the cloud.
is_below_kumo – price below the cloud.
is_in_kumo – price inside the cloud.
These conditions are used as trend / regime filters and for stop-loss & trailing stops.
2.2 Moving Average
You can optionally display and use a trend MA:
Types: SMA, EMA, DEMA, WMA
Length: configurable (default 200)
Source: default close
Filter idea:
If MA Direction Filter is ON:
When Close > MA → strategy allows only Long signals.
When Close < MA → strategy allows only Short signals.
The MA is plotted on the chart (if enabled).
2.3 CCI & Panel
The CCI (Commodity Channel Index) is used for entry timing:
CCI length and source are configurable (default length 20, source hlc3).
Two thresholds:
CCI Upper Threshold (Long) – default +100
CCI Lower Threshold (Short) – default –100
Signals:
Long signal:
CCI crosses up through the upper threshold
cci_val < upper_threshold and cci_val > upper_threshold
Short signal:
CCI crosses down through the lower threshold
cci_val > lower_threshold and cci_val < lower_threshold
There is a panel (table) in the bottom-right corner:
Shows current CCI value.
Shows filter status as colored dots:
Green = filter enabled and passed.
Red = filter enabled and blocking trades.
Gray = filter is disabled.
Filters shown in the panel:
Ichimoku Cloud filter (Long/Short)
Ichimoku Lines filter (Conversion/Base vs Cloud)
MA Direction filter
3. Filters & Trade Direction
All filters can be turned ON/OFF independently.
3.1 Ichimoku Cloud Filter
Purpose: trade only when price is clearly above or below the Kumo.
Long Cloud Filter (Use Ichimoku Cloud Filter) – when enabled:
Long trades only if close > cloud top.
Short Cloud Filter – when enabled:
Short trades only if close < cloud bottom.
If the cloud filter is disabled, this condition is ignored.
3.2 Ichimoku Lines Above/Below Cloud
Purpose: stronger trend confirmation: Ichimoku lines should also be on the “correct” side of the cloud.
Long Lines Filter:
Long allowed only if Conversion Line and Base Line are both above the cloud.
Short Lines Filter:
Short allowed only if both lines are below the cloud.
If this filter is OFF, the conditions are not checked.
3.3 MA Direction Filter
As described above:
When ON:
Close > MA → only Longs.
Close < MA → only Shorts.
4. Anti-Re-Entry Logic (Cloud Touch Reset)
The strategy uses internal flags to avoid continuous re-entries in the same direction without a reset.
Two flags:
allowLong
allowShort
After a Long entry, allowLong is set to false, allowShort to true.
After a Short entry, allowShort is set to false, allowLong to true.
Flags are reset when price touches the Kumo:
If Low goes into the cloud → allowLong = true
If High goes into the cloud → allowShort = true
If Close is inside the cloud → both allowLong and allowShort are set to true
There is a key option:
Wait Position Close Before Flag Reset
If ON: cloud touch will reset flags only when there is no open position.
If OFF: flags can be reset even while a trade is open.
This gives a kind of regime-based re-entry control: after a trend leg, you wait for a “cloud interaction” to allow new signals.
5. Risk Management
All risk management is handled inside the strategy.
5.1 Position Sizing
Order Size % of Equity – default 10%
The strategy calculates:
position_value = equity * (Order Size % / 100)
position_qty = position_value / close
So position size automatically adapts to your current equity.
5.2 Take Profit Modes
You can choose one of two TP modes:
Percent
Fibonacci
5.2.1 Percent Mode
Single Take Profit at X% from entry (default 2%).
For Long:
TP = entry_price * (1 + tp_pct / 100)
For Short:
TP = entry_price * (1 - tp_pct / 100)
One strategy.exit per side is used: "Long TP/SL" and "Short TP/SL".
5.2.2 Fibonacci Mode (2 partial TPs)
In this mode, TP levels are based on a virtual Fib-style extension between entry and stop-loss.
Inputs:
Fib TP1 Level (default 1.618)
Fib TP2 Level (default 2.5)
TP1 Share % (Fib) (default 50%)
TP2 share is automatically 100% - TP1 share.
Process for Long:
Compute a reference Stop (see SL section below) → sl_for_fib.
Compute distance: dist = entry_price - sl_for_fib.
TP levels:
TP1 = entry_price + dist * (Fib TP1 Level - 1)
TP2 = entry_price + dist * (Fib TP2 Level - 1)
For Short, the logic is mirrored.
Two exits are used:
TP1 – closes TP1 share % of position.
TP2 – closes remaining TP2 share %.
Same stop is used for both partial exits.
5.3 Stop-Loss Modes
You can choose one of three Stop Loss modes:
Stable – fixed % from entry.
Ichimoku – fixed level derived from the Kumo.
Ichimoku Trailing – dynamic SL following the cloud.
5.3.1 Stable SL
For Long:
SL = entry_price * (1 - Stable SL % / 100)
For Short:
SL = entry_price * (1 + Stable SL % / 100)
Used both for Percent TP mode and as reference for Fib TP if Kumo is not available.
5.3.2 Ichimoku SL (fixed, non-trailing)
At the time of a new trade:
For Long:
Base SL = cloud bottom minus small offset (%)
For Short:
Base SL = cloud top plus small offset (%)
The offset is configurable: Ichimoku SL Offset %.
Once computed, that SL level is fixed for this trade.
5.3.3 Ichimoku Trailing SL
Similar to Ichimoku SL, but recomputed each bar:
For Long:
SL = cloud bottom – offset
For Short:
SL = cloud top + offset
A red trailing SL line is drawn on the chart to visualize current stop level.
This trailing SL is also used as reference for BreakEven and for Fib TP distance.
6. BreakEven Logic (with BE Lines)
BreakEven is optional and supports two modes:
Percent
Fibonacci
Inputs:
Percent mode:
BE Trigger % (from entry) – move SL to BE when price goes this % in profit.
BE Offset % from entry – SL will be set to entry ± this offset.
Fibonacci mode:
BE Fib Level – Fib level at which BE will be activated (default 1.618, same style as TP).
BE Offset % from entry – how far from entry to place BE stop.
The logic:
Before BE is triggered, SL follows its normal mode (Stable/Ichimoku/Ichimoku Trailing).
When BE triggers:
For Long:
New SL = max(current SL, BE SL).
For Short:
New SL = min(current SL, BE SL).
This means BE will never loosen the stop – only tighten it.
When BE is activated, the strategy draws a violet horizontal line at the BreakEven level (once per trade).
BE state is cleared when the position is closed or when a new position is opened.
7. Entry & Exit Logic (Summary)
7.1 Long Entry
Conditions for a Long:
CCI signal:
CCI crosses up through the upper threshold.
Ichimoku Cloud Filter (optional):
If enabled → price must be above the Kumo.
Ichimoku Lines Filter (optional):
If enabled → Conversion Line and Base Line must be above the Kumo.
MA Direction Filter (optional):
If enabled → Close must be above the chosen MA.
Anti-re-entry flag:
allowLong must be true (cloud-based reset).
Position check:
Long entries are allowed when current position size ≤ 0 (so it can also reverse from short to long).
If all these conditions are true, the strategy sends:
strategy.entry("Long", strategy.long, qty = calculated_qty)
After entry:
allowLong = false
allowShort = true
7.2 Short Entry
Same structure, mirrored:
CCI signal:
CCI crosses down through the lower threshold.
Cloud filter: price must be below cloud (if enabled).
Lines filter: conversion & base must be below cloud (if enabled).
MA filter: Close must be below MA (if enabled).
allowShort must be true.
Position check: position size ≥ 0 (allows reversal from long to short).
Then:
strategy.entry("Short", strategy.short, qty = calculated_qty)
Flags update:
allowShort = false
allowLong = true
7.3 Exits
While in a position:
The strategy continuously recalculates SL (depending on chosen mode) and, in Percent mode, TP.
In Fib mode, fixed TP levels are computed at entry.
BreakEven may raise/tighten the SL if its conditions are met.
Exits are executed via strategy.exit:
Percent mode: one TP+SL exit per side.
Fib mode: two partial exits (TP1 and TP2) sharing the same SL.
At position open, the script also draws visual lines:
White line — entry price.
Green line(s) — TP level(s).
Red line — SL (if not using Ichimoku Trailing; with trailing, the red line is updated dynamically).
Maximum of 30 lines are kept to avoid clutter.
8. How to Use the Strategy
Choose market & timeframe
Works well on trending instruments. Try crypto, FX or indices on H1–H4, or intraday if you prefer more trades.
Adjust Ichimoku settings
Keep defaults (9/26/52/26) or adapt to your timeframe.
Configure Moving Average
Typical: EMA 200 as a trend filter.
Turn MA Direction Filter ON if you want to trade only with the main trend.
Set CCI thresholds
Default ±100 is classic.
Lower thresholds → more signals, higher noise.
Higher thresholds → fewer but stronger signals.
Enable/disable filters
Turn on Ichimoku Cloud and Ichimoku Lines if you want only “clean” trend trades.
Use Wait Position Close Before Flag Reset to control how often re-entries are allowed.
Choose TP & SL mode
Percent mode is simpler and easier to understand.
Fibonacci mode is more advanced: it aligns TP levels with the distance to stop, giving asymmetric RR setups (two partial TPs).
Choose Stable SL for fixed-risk trades, or Ichimoku / Ichimoku Trailing to tie stops to the cloud structure.
Set BreakEven
Enable BE if you want to lock in risk-free trades after a certain move.
Percent mode is straightforward; Fib mode keeps BreakEven in harmony with your Fib TP setup.
Run Backtest & Optimize
Press “Add to chart” → go to Strategy Tester.
Adjust parameters to your market and timeframe.
Look at equity curve, PF, drawdown, average trade, etc.
Live / Paper Trading
After you’re satisfied with backtest results, use the strategy to generate signals.
You can mirror entries/exits manually or connect them to alerts (if you build an alert-based execution layer).

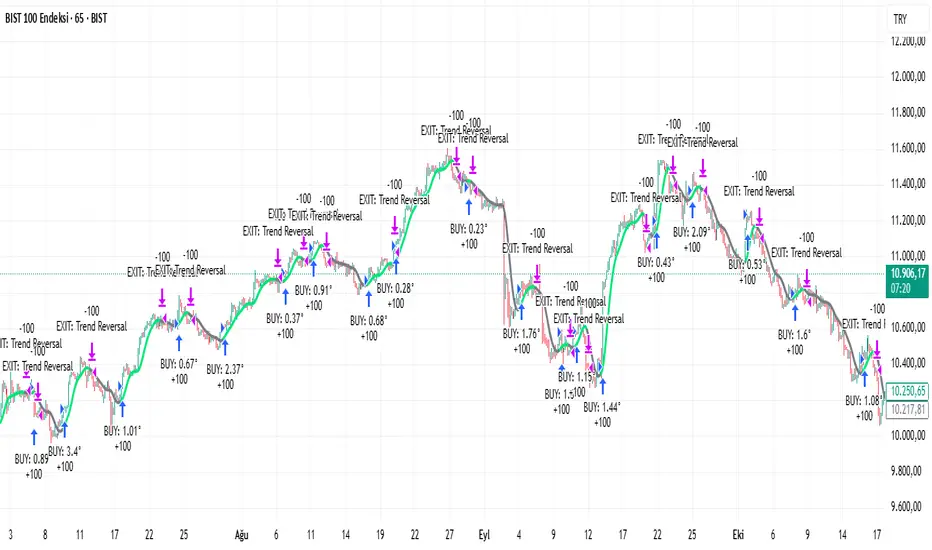
Recursive WMA Angle StrategyDescription: This strategy utilizes a recursive Weighted Moving Average (WMA) calculation to determine the trend direction and strength based on the slope (angle) of the curve. By calculating the angle of the smoothed moving average in degrees, the script filters out noise and aims to enter trades only during strong momentum phases.
How it Works:
Recursive WMA: The script calculates a series of nested WMAs (M1 to M5), creating a very smooth yet responsive curve.
Angle Calculation: It measures the rate of change of this curve over a user-defined lookback period and converts it into an angle (in degrees).
Entry Condition (Long): A long position is opened when the calculated angle exceeds the Min Angle for BUY threshold (default: 0.2), indicating a strong upward trend.
Exit Condition: The position is closed when the angle drops below the Min Angle for SELL threshold (default: -0.2), indicating a sharp trend reversal.
Settings:
MA Settings: Adjust the base lengths for the recursive calculation.
Angle Settings: Fine-tune the sensitivity by changing the Buy/Sell angle thresholds.
Date Filter: Restrict the backtest to a specific date range.
Note: This strategy is designed for Long-Only setups.
Rasta Long/Short — StrategyThe Rasta Long/Short Strategy is a visual and educational framework designed to help traders study momentum shifts that appear when a fast EMA interacts with a slower smoothed baseline.
It is not a signal service. Instead, it is a research tool that helps you observe transitions, structure, and behavior across different market conditions and smoothing contexts.
The script plots:
A primary EMA line (fast reaction wave).
A Smoothed line (your chosen smoothing method).
Color-coded fog regions showing directional bias.
Optional DNA rung connections between the two lines for structural comparison.
Together, these allow a deeper study of how momentum pushes, volatility compression, expansions, and drift emerge around fast/slow EMA interactions.
✦ Core Idea
The Rasta Long/Short mechanism studies how price behaves when the fast EMA crosses above or below a smoothed anchor.
Rather than predicting price, it reveals where transitions occur across different structures, timeframes, and smoothing techniques.
The Long/Short logic simply highlights flips in directional structure.
It is not intended for real-time signals or automated execution; it is intended for understanding market movement.
✦ Smoothing Types (Explained)
The strategy allows experimenting with several smoothing families to observe how they transform the fast EMA:
SMA (Simple Moving Average)
Averaged, slower response. Good for stability comparisons.
EMA (Exponential)
Faster reaction, more responsive, smoother behavior during momentum.
RMA (Wilder’s)
Used in RSI calculations; steady, well-balanced response.
WMA (Weighted)
More weight to recent bars; bridges SMA and EMA dynamics.
None
Raw EMA vs EMA interaction with no secondary smoothing.
Each smoothing type provides unique structural information and can lead to different interpretations.
✦ Modes of Study
Designed for multi-timeframe research:
1H / 4H — Momentum flow mapping and structural identification.
Daily / Weekly — Higher-timeframe rotations, macro structure transitions.
1–15m — Microstructure studies, noise vs trend emergence.
Use the built-in Strategy Tester to explore entry/exit context, but treat results as research, not predictive performance.
✦ Components (Visual Study Tools)
EMA Line (Fast)
Primary reactive wave. Shows fast directional shifts.
Smoothed Line (Slow)
Trend baseline / reference structure.
Fog Region
Highlights fast-vs-smoothed directional alignment.
DNA Rungs (Optional)
Structural “bridges” showing the exact relationship between waves on each bar.
Useful for studying separation, compression, and expansions.
✦ Educational Insights
This strategy helps illuminate:
How fast and slow EMAs interact dynamically.
How structure changes precede trend emergence.
Where volatility compresses before expansion.
How noise, drift, and clean reversals differ.
How different smoothers alter the interpretation of the same price data.
The goal is clarity — not prediction.
✦ How to Use
Apply to any timeframe or instrument.
Enable or disable fog depending on preferred visibility.
Use DNA rungs for close structural comparison.
Observe long/short flips as educational reference points — not signals.
Study transitions visually, then backtest using the Strategy Tester for pattern research.
✦ Disclaimer
This script is provided for educational and research purposes only.
It does not provide trading signals, financial advice, or recommendations.
Past behavior does not indicate future performance.
Always practice risk-aware study and consult qualified financial professionals when needed.
✦ Author
Michael Culpepper (mikeyc747)
Creator of the Rasta framework and related market structure studies.

MSB Trend Breakout Strategy V7**MSB Trend Breakout Strategy V7**
This is the full, high-precision automated strategy designed for disciplined traders who understand directional price action. The script functions as a robust **entry and trade management tool** following two proprietary concepts:
**1. Trend Confirmation:** A customized Moving Average filter is utilized to ensure entries strictly align with the dominant market flow.
**2. Momentum Confirmation:** The system uses a specific short-term **multi-bar breakout range** to pinpoint high-probability entries at the start of a momentum shift, avoiding choppy market conditions.
**Key Features:**
* **Automated Risk Management:** Includes complete dynamic Stop Loss (SL) and Take Profit (TP) order management to ensure capital preservation.
* **Time Filter:** Optimizes performance by filtering signals to the most liquid Forex trading hours (01:00 to 19:00, broker time).
**PREREQUISITE FOR ACCESS:**
This is an advanced tool. To utilize the strategy effectively, the user should have a foundational understanding of directional bias and trade management principles.
---
**Important Note & Risk Disclosure:**
This strategy is published under **Invite-only** protection. The script does not provide financial advice or guarantee profits. Past performance is not indicative of future results.

Morning Straddle Backtest + Range Filter Morning Straddle Backtest
Purpose:
This script tests a Morning Straddle concept where a trader enters both long and short breakout orders based on the overnight range (22:00–06:00 by default).
It is designed for backtesting the effectiveness of volatility breakouts following low-volume overnight sessions.
Setup
Overnight session: 22:00–06:00 (adjustable).
At the end of the overnight session, the script automatically places:
A long stop order above the range high.
A short stop order below the range low.
Both use an ATR-based buffer for cleaner breakouts (default 5%).
When one side triggers, the opposite order is cancelled if OCO mode is active.
Adjustable Parameters
- Session - Defines the overnight hours used for the range.
- ATR Length - Number of bars used for ATR calculation.
- ATR Buffer % - Distance above/below range for entry & stop placement.
- Risk:Reward Ratio - Determines the TP distance relative to SL.
- Stop-Loss - Choose between “Behind Range” or “Mid-Range (50%)” with ATR buffer added.
- OCO - Cancels opposite order once one side triggers.
- Close All EOD - Closes all open trades at the end of day (default 22:00).
- Range Filter – Enables filtering of trades only when the overnight range size falls within a defined threshold.
-Min Range / Max Range – Define acceptable range size boundaries.
-Display Units – Select whether the filter is measured in Price Change, Pips, or Points.
- Stats Panel Settings – Toggle visibility, position (Top/Bottom Left/Right), and background opacity.
Visual
The overnight range (22:00–06:00) is highlighted on the chart with a teal background for clarity.
No lines are drawn for the high and low.
Strategy Notes
Works best on 5m or 15m charts where the overnight range can be clearly defined.
Backtests should be run over multiple months to gauge performance consistency.
Can be adapted for other markets by adjusting session times and ATR settings. For example, S&P initial balance breakout using 14:30-15:30 range time.
Stats Panel Displays
- 20-Day Range Data: Maximum, Average, and Minimum range sizes.
- Today’s Range: With automatic classification — Huge, Normal, or Small.
- Average Winning Range: Average size of the overnight range on profitable days.
- Average Losing Range: Average size of the overnight range on losing days.
- Filter Status: Displays whether the range met the filter criteria — Range OK, Skipped, or Off.

nOI + Funding + CVD • strategynOI + Funding + CVD Strategy
Overview
This strategy is designed for cryptocurrency trading on platforms like TradingView, focusing on perpetual futures markets. It combines three key indicators—Normalized Open Interest (nOI), Funding Rate, and Cumulative Volume Delta (CVD)—to generate buy and sell signals for long and short positions. The strategy aims to capitalize on market imbalances, such as overextended open interest, funding rate extremes, and volume deltas, which often signal potential reversals or continuations in trending markets.
The script supports pyramiding (up to 10 positions), uses percentage-based position sizing (default 10% of equity per trade), and allows customization of trade directions (longs and shorts can be enabled/disabled independently). It includes multiple signal systems for entries, various exit mechanisms (including stop-loss, take-profit, time-based exits, and conditional closes based on indicators), a Martingale add-on system for averaging positions during drawdowns, and handling of opposite signals (ignore, close, or reverse).
This strategy is not financial advice; backtest thoroughly and use at your own risk. It requires data sources for Open Interest (OI) and Funding Rates, which are fetched via TradingView's security functions (e.g., from Binance for funding premiums).
Key Indicators
1. Normalized Open Interest (nOI)
Group: Open Interest
Purpose: Measures the relative level of open interest over a lookback window to identify overbought (high OI) or oversold (low OI) conditions, which can indicate potential exhaustion in trends.
Calculation:
Fetches OI data (close) from the symbol's standard ticker (e.g., "{symbol}_OI").
Normalizes OI within a user-defined window (default: 500 bars) using min-max scaling: (OI - min_OI) / (max_OI - min_OI) * 100.
Upper threshold (default: 70%): Signals potential short opportunities when crossed from above.
Lower threshold (default: 30%): Signals potential long opportunities when crossed from below.
Visualization: Plotted as a line (teal above upper, red below lower, gray in between). Horizontal lines at upper, mid (50%), lower, and a separator at 102%.
Notes: Handles non-crypto symbols by adjusting timeframe to daily if intraday. Errors if no OI data available.
2. Funding Rate
Group: Funding Rate
Purpose: Tracks the average funding rate (premium index) to detect market sentiment extremes. Positive funding suggests bull bias (longs pay shorts), negative suggests bear bias.
Calculation:
Fetches premium index data from Binance (e.g., "binance:{base}usdt_premium").
Supports lower timeframe aggregation (default: enabled, using 1-min TF) for smoother data.
Averages open and close premiums, clamps values, and scales/shifts for plotting (base: 150, scale: 1000x).
Upper threshold (default: 1.0%): Overheat for shorts.
Lower threshold (default: 1.0%): Overcool for longs.
Ultra level (default: 1.8%): Extreme for additional short signals.
Smoothing: Uses inverse weighted moving average (IWMA) or lower-TF aggregation to reduce noise.
Visualization: Shifted plot (green positive, red negative) with filled areas. Horizontal lines for overheat, overcool, base (0%), and ultra.
Notes: Custom ticker option for non-standard symbols.
3. Cumulative Volume Delta (CVD)
Group: CVD (Cumulative Volume Delta)
Purpose: Measures net buying/selling pressure via volume delta, normalized to identify divergences or confirmations with price.
Calculation:
Delta: +volume if close > open, -volume if close < open.
Cumulative: Rolling cumsum over a window (default: 500 bars), smoothed with EMA (default: 20).
Normalized: Scaled by absolute max in window (-1 to 1 range).
Scaled/shifted for plotting (base: 300 or 0 if anchored, scale: 120x).
Upper threshold (default: 1.0%): Over for shorts.
Lower threshold (default: 1.0%): Under for longs.
Visualization: Shifted plot (aqua positive, purple negative) with filled areas. Horizontal lines for over, under, and separator (default: 252).
Filter Options (for Signal A):
Enable filter (default: false).
Require sign match (Long ≥0, Short ≤0).
Require extreme zones.
Require momentum (rising/falling over N bars, default: 3).
Signal Logics for Entries
Entries are triggered by buy/sell signals from multiple systems (A, B, C, D), filtered by direction toggles and entry conditions.
Signal System A: OI + Funding (with optional CVD filter)
Enabled: Default true.
Sell (Short): nOI > upper threshold, falling over N bars (default: 3), delta ≥ threshold (default: 3%), funding > overheat, and CVD filter OK.
Buy (Long): nOI < lower threshold, rising over N bars (default: 3), delta ≥ threshold (default: 3%), funding < overcool, and CVD filter OK.
Signal System B: Short - Funding Crossunder + Filters
Enabled: Default true.
Sell (Short): Funding crosses under overheat level, optional: CVD > over, nOI < upper.
Signal System C: Short - Ultra Funding
Enabled: Default false.
Sell (Short): Funding crosses ultra level (up or down, both default true).
Signal System D: Long - Funding Crossover + Filters
Enabled: Default true.
Buy (Long): Funding crosses over overcool level, optional: CVD < under, nOI > lower.
Combined: Sell if A/B/C active; Buy if A/D active.
Entry Filters
Cooldown: Optional pause between entries (default: false, 3 bars).
Max Entries: Limit pyramiding (default: true, 6 max).
Entries only if both filters pass and direction allowed.
Opposite Signal Handling
Mode: Ignore (default), Reverse (close and enter opposite), or Close (exit only).
Processed before regular entries.
Position Management
Martingale (3 Steps):
Enabled per step (default: all true).
Triggers add-ons at loss levels (defaults: 5%, 8%, 11%) by adding % to position (default: 100% each).
Resets on position close.
Break Even:
Enabled (default: true).
Activates at profit threshold (default: 5%), sets SL better by offset (default: 0.1%).
Exit Systems
Multiple exits checked in sequence.
Exit 1: SL/TP
Enabled: Separate for long/short (default: true).
SL: % from avg price (defaults: 1% long/short).
TP: % from avg price (defaults: 2% long/short).
Exit 2: Funding
Enabled: Separate for long (up) / short (down) (default: true).
Long Exit: Funding > upper exit threshold (default: 0.8%).
Short Exit: Funding < lower exit threshold (default: 0.8%).
Exit 3: nOI
Enabled: Separate for long (up) / short (down) (default: true).
Long Exit: nOI > upper exit (default: 85%).
Short Exit: nOI < lower exit (default: 15%).
Exit 4: Global SL
Enabled: Default true.
Exit: If position loss ≥ % (default: 7%).
Exit 5: Break Even (integrated in position block)
Exit 6: Time Limit
Enabled: Separate for long/short (default: true).
Exit: After N bars in trade (defaults: 30 each).
Timer updates on add-ons if enabled (default: true).
Visual Elements
Buy/Sell Labels: Small labels ("BUY"/"SELL") on bars with signals, limited to last 30.
All indicators plotted on a separate pane (overlay=false).
Usage Notes
Backtesting: Adjust parameters based on asset/timeframe. Test on historical data.
Data Requirements: Works best on crypto perps with OI and funding data.
Risk Management: Incorporates SL/TP and global SL; monitor drawdowns with Martingale.
Customization: All thresholds, enables, and scales are inputs for fine-tuning.
Version: Pine Script v6.
For questions or improvements, contact the author. Happy trading!

coinbot_mr_table이 스크립트는 **"MA 리본(Moving Average Ribbon) 기반 자동매매 전략"**입니다.
이름(coinbot_mr_table)에 모든 기능이 요약되어 있습니다.
coinbot: user_id, exchange, leverage 등 자동매매 봇과 연동하기 위한 웹훅(Webhook) 신호 전송 기능이 포함되어 있습니다.
mr (MA Ribbon): 18개(5~90)의 이동평균선(EMA 또는 SMA)이 100 이평선을 기준으로 정배열/역배열되는지를 색상(LIME/RUBI)으로 구분하여 추세를 판단합니다.
table: 전략의 백테스팅 성과(총 승률, 일일 수익률 등)를 차트 위에 '누적 통계'와 '일일 통계' 테이블로 시각화해 줍니다.
이 스크립트의 매매 로직과 자동매매 신호에 대한 자세한 설명을 한글과 영어로 각각 제공해 드립니다.
🇰🇷 한글 (Korean)
이 스크립트는 **"MA 리본(Moving Average Ribbon)"**을 핵심 엔진으로 사용하는 완전 자동매매(Autotrade) 전략 신호 생성기입니다.
이 지표의 목적은 차트에서 추세를 시각적으로 보여주는 것을 넘어, 구체적인 매매 신호(진입, 분할 익절, 손절)가 발생할 때마다 JSON 형식의 명령어를 자동매매 봇으로 전송하는 것입니다.
1. 📈 매매 전략: MA 리본 추세 추종
이 전략은 18개의 단기/중기 이동평균선(5~90)과 1개의 장기 이동평균선(100)을 사용하여 추세를 정의합니다.
100 이평선: 장기 추세를 가르는 기준선(강/약을 나누는 분수령)입니다.
18개 리본: 이 리본들이 100 이평선 위에서 모두 상승(LIME 색상)하면 '강세 추세', 아래에서 모두 하락(RUBI 색상)하면 '약세 추세'로 판단합니다.
2. 🚦 진입 및 청산 신호
이 전략은 '전환(Reversing)' 전략입니다. 즉, 롱 신호가 발생하면 숏 포지션을 종료하고 롱으로 진입하며, 그 반대도 마찬가지입니다. (항상 롱 또는 숏 포지션을 유지합니다.)
진입 신호 (Long):
추세 확정: 모든 리본이 100 이평선 위에서 '강세(LIME)'로 통일될 때.
재진입 (불타기): 강세 추세 중, 리본이 일시적으로 조정(GREEN)을 보이다가 다시 '강세(LIME)'로 복귀할 때.
진입 신호 (Short):
추세 확정: 모든 리본이 100 이평선 아래에서 '약세(RUBI)'로 통일될 때.
재진입 (물타기): 약세 추세 중, 리본이 일시적으로 반등(MAROON)하다가 다시 '약세(RUBI)'로 복귀할 때.
청산 신호 (자동매매):
진입 (ENTRY): 롱/숏 신호 발생 시, 설정한 user_id, exchange, leverage 등을 포함한 JSON 메시지를 전송합니다.
익절 (TAKE_PROFIT): 롱/숏 포지션이 사용자가 설정한 TP1, TP2, TP3 목표가에 도달하면, 설정된 물량(qty_percent)만큼 분할 익절하라는 JSON 메시지를 전송합니다.
손절 (CLOSE): 포지션이 설정한 sl_percent에 도달하면, 포지션을 즉시 종료하라는 JSON 메시지를 전송합니다.
3. 📊 핵심 기능: 통계 테이블
이 스크립트는 백테스팅 성과를 두 개의 테이블로 요약하여 차트에 실시간으로 표시합니다.
누적 통계 (Total Stats): 전체 기간의 총 진입 횟수, 승/패, 승률(Winrate), 총수익률(Total Profit) 등을 보여줍니다.
일일 통계 (Daily Stats): '오늘' 하루 동안 발생한 매매의 성과(승/패, 승률, 수익률)만 따로 집계하여 보여줍니다.
🇺🇸 영어 (English)
This script is an automated trading (Autotrade) strategy signal generator based on a "Moving Average (MA) Ribbon."
Its purpose extends beyond visual trend analysis; it is designed to generate specific JSON-formatted commands and send them to an automated trading bot whenever a trade signal (entry, take-profit, stop-loss) occurs.
1. 📈 Trading Strategy: MA Ribbon Trend Following
This strategy uses 18 short-to-mid-term Moving Averages (5 to 90) and one long-term Moving Average (100) to define the trend.
100-MA: This acts as the baseline filter, dividing the market into a long-term bull or bear state.
18-MA Ribbon: When all 18 ribbons are above the 100-MA and rising (LIME color), it defines a 'Strong Bull Trend'. When all are below the 100-MA and falling (RUBI color), it defines a 'Strong Bear Trend'.
2. 🚦 Entry and Exit Signals
This is a 'Reversing' strategy. This means when a long signal occurs, it closes any existing short position and enters long, and vice-versa. It is designed to hold a position (either long or short) at all times.
Long Entry Signals:
Trend Confirmation: When all ribbons unify into a 'Strong Bull' (LIME) state above the 100-MA.
Re-entry (Buy the Dip): During a bull trend, if the ribbon shows a temporary pullback (GREEN) and then flips back to 'Strong Bull' (LIME).
Short Entry Signals:
Trend Confirmation: When all ribbons unify into a 'Strong Bear' (RUBI) state below the 100-MA.
Re-entry (Sell the Rally): During a bear trend, if the ribbon shows a temporary rally (MAROON) and then flips back to 'Strong Bear' (RUBI).
Exit Signals (For Automation):
ENTRY: When a long/short signal occurs, it sends a JSON message with the user's user_id, exchange, leverage, etc.
TAKE_PROFIT: When a position reaches the user-defined TP1, TP2, or TP3 price targets, it sends a JSON message to take profit on the specified quantity (qty_percent) for that portion.
CLOSE (Stop-Loss): When a position hits the sl_percent threshold, it sends a JSON message to immediately close the entire position.
3. 📊 Key Feature: Statistics Tables
The script provides two real-time summary tables on the chart to visualize backtesting performance.
Cumulative Stats: Shows lifetime performance, including total trades, wins, losses, win rate, and total profit.
Daily Stats: Isolates and displays the performance metrics (wins, losses, win rate, profit) for "Today's" trading activity only.

PriceAction & Economic StrategyThis indicator combines price-action logic with macroeconomic data to generate trading signals.
Features:
- Price-action signals: A bullish signal occurs when a candle closes above its open; a bearish signal occurs when a candle closes below its open.
- Signal gap: The indicator includes an input called "Signal Gap (bars)" that defines the minimum number of bars between signals. By default the gap is set to 3, but you can adjust this between 1 and 10 to control signal frequency.
- Alerts: The script defines alert conditions for long and short signals, allowing you to create TradingView alerts that notify you when a new signal occurs.
- Economic data: The script uses TradingView's built-in `request.economic()` function to request U.S. GDP data. The GDP series is plotted in the Data Window for additional macroeconomic context.
How to use:
1. Add the indicator to a chart.
2. Open the indicator's settings and adjust the "Signal Gap (bars)" input to set the minimum bar gap between signals.
3. Look for green triangles plotted below the bars (bullish signals) and red triangles plotted above the bars (bearish signals). These appear only when the gap criterion is met.
4. If you want alerts, click the Alert button in TradingView, select this indicator, and choose either the Long or Short alert conditions.
5. To view the GDP data, open the Data Window; the GDP value will be shown alongside other series for each bar.
6. Use these signals in combination with your own analysis; this indicator is for educational purposes and does not constitute financial advice.

CyberTrading-Inside Hunt RobotThis Pine Script strategy, titled "Cyber-Inside", is a fully automated entry and risk management system built around inside bar pierce patterns and ATR-based dynamic stops/targets. It identifies specific candle formations, calculates position sizing based on risk percentage, and visually displays risk/reward zones and trade labels on the chart.
Detailed Explanation
1. Core Logic
The script searches for inside bars — candles whose high and low are contained within the previous bar — that appear after a valid “normal” or “long” range candle.
Then it waits for a wick pierce (a candle that breaks the previous inside bar's range slightly but closes inside).
That wick pierce acts as a potential reversal or continuation signal:
wickDown → possible long entry
wickUp → possible short entry
2. ATR-based Classification
Each candle is compared to the ATR(24):
Spinning (small) → below 0.8 × ATR
Standard → between 0.8× and 1.2× ATR
Long → between 1.2× and 2.5× ATR
Huge → above 2.5× ATR
Only certain candle types (standard or long) in the previous bars qualify for pattern validation.
3. Entry Conditions
A trade signal occurs when:
The current bar forms a wick pierce of a prior inside bar pattern.
No active position exists (strategy.position_size == 0).
Then:
For longs, entry at close, stop at previous low minus ATR buffer.
For shorts, entry at close, stop at previous high plus ATR buffer.
4. Risk Management
The stop distance defines the risk per trade, and the position size is adjusted dynamically so that only the chosen riskPercent (e.g., 1%) of equity is at risk.
If useRR is enabled, a take-profit target is placed using the defined risk/reward multiple (rr, e.g. 1:3).
If disabled, the target defaults to the previous candle’s high or low.
5. Visualization
The strategy visually marks:
Entry points (triangles)
Red box = risk zone (entry → stop)
Green box = reward zone (entry → target)
Optional diagonal and horizontal lines for clarity
Labels updated after trade closes with PnL values (profit or loss)
6. Application
This system helps traders:
Automate inside-bar breakout or reversal entries
Maintain strict risk-based position sizing
Visually assess trade zones and risk/reward areas
Backtest and evaluate performance consistency on various timeframes and assets
Larry Williams Bonus Track PatternThis strategy trades the day immediately following an Inside Day, under specific directional and timing conditions. It is designed for daily-based setups but executed on intraday charts to ensure orders are placed exactly at the open of the following day, rather than at the daily bar close.
Entry Conditions
Only trades on Monday, Thursday, or Friday.
The previous day must be an Inside Day (its high is lower than the prior high and its low is higher than the prior low).
The bar before the Inside Day must be bullish (close > open).
On the following day (t):
The daily open must be below both the Inside Day’s high and the highest high of the two days before that.
A buy stop is placed at the highest high of the three previous days (Inside Day and the two days before it).
If the new day’s open is already above that level (gap up), the strategy enters long immediately at the open.
Exit Rules
Stop Loss: Fixed, defined in points or percentage (user input).
FPO (First Profitable Open): the position is closed at the first daily open after the entry day where the open price is above the average entry price (the first profitable open).
Notes
The script must be applied on an intraday timeframe (e.g., 15-minute or 1-hour) so that the strategy can:
Detect the Inside Day pattern using daily data (request.security).
Execute orders in real time at the next day’s open.
Running it directly on the daily timeframe will delay executions by one bar due to Pine Script’s evaluation model.

Kootch Moon Phase Strategy🌙 Moon Phases Equity Strategy
This strategy explores the relationship between lunar cycles and equity price action.
It is based on a simple idea: markets may respond differently around New Moons and Full Moons.
🛠 How it works
• New Moon → Long Entry
The strategy enters a long position at the first bar after a New Moon event.
• Full Moon → Exit
The strategy closes the long position at the first bar after the following Full Moon.
• Optional Filters
• 200-day Moving Average (on by default): only take longs in bullish regimes.
• ATR-based Stops & Targets: risk management can be added with configurable multiples of ATR.
• Minimum Gap: ensures a cooldown period between trades to avoid clustering.
• Position Sizing: by default, trades risk a configurable % of equity (set to 35%).
📊 Notes
• This script is designed for equities (stocks, ETFs).
• It is a long-only system by default. If you enable “Always Flip,” the script will alternate long/short each lunar phase, but that is more experimental.
• Results can vary widely depending on the underlying asset. Trending stocks (e.g., AMZN, AAPL, SPY) tend to perform better with the long-only mode.
• Risk/Reward tracking in R-multiples is included for more consistent performance evaluation.
⚠️ Disclaimer
This strategy is for educational and research purposes only. It does not guarantee profitability and should not be used as financial advice. Past performance does not indicate future results. Always backtest on your preferred instruments and use sound risk management.

RSI Momentum ScalperOverview
The "RSI Momentum Scalper" is a Pine Script v5 strategy crafted for trading highly volatile markets, with a special focus on newly listed cryptocurrencies. This strategy harnesses the Relative Strength Index (RSI) alongside volume analysis and momentum thresholds to pinpoint short-term trading opportunities. It supports both long and short trades, managed with customizable take profit, stop loss, and trailing stop levels, which are visually plotted on the chart for easy tracking.
Why I Created This Strategy
I developed the "RSI Momentum Scalper" because I was seeking a reliable trading strategy tailored to newly listed, highly volatile cryptocurrencies. These assets often experience rapid price fluctuations, rendering traditional strategies less effective. I aimed to create a tool that could exploit momentum and volume spikes while managing risk through adaptable exit parameters. This strategy is designed to address that need, offering a flexible approach for traders in dynamic crypto markets.
How It Works
The strategy utilizes RSI to identify momentum shifts, combined with volume confirmation, to trigger long or short entries. Trades are controlled with take profit, stop loss, and trailing stop levels, which adjust dynamically as the price moves in your favor. The trailing stop helps lock in profits, while the plotted exit levels provide clear visual cues for trade management.
Customizable Settings
The script is highly customizable, allowing you to adjust it to various market conditions and trading styles. Here’s a brief overview of the key settings:
Trade Mode: Select "Both," "Long Only," or "Short Only" to determine the trade direction.
(Default: Both)
RSI Length: Sets the lookback period for the RSI calculation (2 to 30).
(Default: 8)
A shorter length increases RSI sensitivity, suitable for volatile assets.
RSI Overbought: Defines the upper RSI threshold (60 to 99) for short entries.
(Default: 90)
Higher values signal stronger overbought conditions.
RSI Oversold: Defines the lower RSI threshold (1 to 40) for long entries.
(Default: 10)
Lower values indicate stronger oversold conditions.
RSI Momentum Threshold: Sets the minimum RSI momentum change (1 to 15) to trigger entries.
(Default: 14)
Adjusts the sensitivity to price momentum.
Volume Multiplier: Multiplies the volume moving average to filter high-volume bars (1.0 to 3.0).
(Default: 1)
Higher values require stronger volume confirmation.
Volume MA Length: Sets the lookback period for the volume moving average (5 to 50).
(Default: 13)
Influences the volume trend sensitivity.
Take Profit %: Sets the profit target as a percentage of the entry price (0.1 to 10.0).
(Default: 4.15)
Determines when to close a winning trade.
Stop Loss %: Sets the loss limit as a percentage of the entry price (0.1 to 6.0).
(Default: 1.85)
Protects against significant losses.
Trailing Stop %: Sets the trailing stop distance as a percentage (0.1 to 4.0).
(Default: 2.55)
Locks in profits as the price moves favorably.
Visual Features
Exit Levels: Take profit (green), fixed stop loss (red), and trailing stop (orange) levels are plotted when in a position.
Performance Table: Displays win rate, total trades, and net profit in the top-right corner.
How to Use
Add the strategy to your chart in TradingView.
Adjust the input settings based on the cryptocurrency and timeframe you’re trading.
Monitor the plotted exit levels for trade management.
Use the performance table to assess the strategy’s performance over time.
Notes
Test the strategy on a demo account or with historical data before live trading.
The strategy is optimized for short-term scalping; adjust settings for longer timeframes if needed.

CoinGpt NQ策略# CoinGpt NQ 策略(MACD·多因子·可金字塔)
## 概述
**CoinGpt NQ策略**是一套面向 **纳指期货 NQ(建议:`CME_MINI:NQ1!`)30 分钟** 的可运行交易策略。
核心以 **MACD 趋势动量** 为骨架,叠加 **EMA 趋势过滤**、**可选金字塔加仓**、**三种出场模式(固定 TP/SL、追踪、追踪+TP)** 与 **风控上限**,提供三套一键预设(Balanced / Trend / Scalper),满足不同市场状态与风险偏好。
> 适配:期货/连续合约;仅做多(本脚本版本)。
> 时间框架:**30m**(可在“仅在 30m 生效”开关控制)。
---
## 进场逻辑
* **信号触发**:`MACD 上穿 Signal`(并要求直方图连续上升 2 根)。
* **趋势过滤**:价格位于 `EMA(p_emaLen)` 上方,且 `MACD>0 & Signal>0`(可关闭)。
* **时间框架限制**:默认仅在 30m 有效(可关闭)。
## 出场逻辑
* **固定 TP/SL**:按百分比计算限价止盈与止损。
* **追踪止盈**:默认以 **ATR 偏移** 跟踪;
* **追踪 + TP**:在拖尾的同时设置上沿 TP。
* **反向保护**:`MACD 下穿 Signal` 时市价平仓。
> 出场模式在输入项 **「出场模式」** 选择:
> `Auto(by preset) / Fixed TP/SL / Trailing / Trailing + TP`
---
## 金字塔加仓(可选)
* 仅在已有多单且不利回撤达到阈值时触发;
* 最多 `p_maxAdds` 层;每层在 **上次加仓价** 基础上按 `p_addStep%` 回撤触发;
* 目的:**拉低均价、提高持仓性价比**;采用小步长、有限层数控制回撤风险。
---
## 风险管理
* **当日最大亏损**:`strategy.risk.max_intraday_loss(p_maxDailyDD, %权益)`
* **单笔头寸上限**:`strategy.risk.max_position_size(p_posCapPct)`
* **订单量**(策略属性):默认 **90% 权益**。
* 实盘更建议:Balanced≈**40%**、Trend≈**35%**、Scalper≈**30%**(在“策略属性 → 订单大小”中调整)。
---
## 三套预设(参数一键生效)
| 预设 | MACD(fast/slow/signal) | 趋势EMA | 金字塔 | 加仓步长 | 固定TP/SL(%) | 追踪(ATR倍数) | 单笔上限 | 当日亏损 |
| ---------------- | ---------------------- | ----- | --- | ----- | ----------------- | --------- | ---- | ---- |
| **Balanced(默认)** | 8 / 21 / 5 | 233 | 2 层 | 0.12% | TP 0.22 / SL 0.15 | 1.2× | 50% | 1.5% |
| **Trend** | 10 / 24 / 7 | 200 | 3 层 | 0.10% | TP 0.25 / SL 0.18 | 1.6× | 45% | 1.2% |
| **Scalper** | 6 / 19 / 4 | 100 | 关闭 | —— | TP 0.18 / SL 0.12 | 1.3× | 35% | 1.0% |
> 说明:
>
> * Balanced:均衡型,适合多数时期;
> * Trend:顺势拉伸,持仓更久、盈亏比更高;
> * Scalper:快进快出、高胜率、不过度叠仓。
---
## 使用建议
1. **品种/周期**:`CME_MINI:NQ1!`(或当季主力合约),**30m**。
2. **手续费**:本策略默认 **1 USD/合约**(在“策略属性”可按实盘成本调整)。
3. **成交精度**:建议在“策略属性 → 高级设置”勾选 **Bar Magnifier**,提升限价/拖尾成交模拟精度。
4. **仓位**:策略默认 90% 仅为展示;回测与实盘更建议 **30%\~40% 权益**。
5. **风险**:金字塔仅做轻量、有限层数;若市场极端震荡,适当降低单笔上限与当日亏损阈值。
---
## 输入项(TradingView 右侧面板)
* **参数预设**:`Balanced / Trend / Scalper`
* **仅在 30m 周期生效**:开/关
* **出场模式**:`Auto(by preset) / Fixed TP/SL / Trailing / Trailing + TP`
> 其余细节参数由预设自动注入,无需手动繁杂调整,**开箱即用**。
---
## 注意事项
* 本脚本为研究与教育用途,不构成投资建议。期货与杠杆交易风险高,请在可承受范围内使用。
* 预设适配历史统计特征,未来表现不保证;建议结合自身风控与账户规模,先小仓/纸面验证。
* 仅做多版本;若需要双向(多空)或加入 RTH(美股盘中)/HTF(更高周期确认)等扩展,请在评论区留言。
---
**作者注**:
* 本策略在 Pine v6 编写,避免了常见的 v6 语法踩坑(如 `strategy.risk.max_position_size()` 仅 1 参、`plot` 标题需常量、追踪需成对参数 `trail_price + trail_offset` 等)。
* 欢迎在评论区反馈你的回测截图(区间、手续费、订单量),我会根据数据给出更贴合你的参数档。
# CoinGpt NQ Strategy (MACD · Multi-Factor · Optional Pyramiding)
## Overview
**CoinGpt NQ Strategy** is a ready-to-trade system for **Nasdaq-100 futures (NQ; recommended: `CME_MINI:NQ1!`) on the 30-minute timeframe**.
It uses **MACD momentum** as the backbone, adds an **EMA trend filter**, optional **pyramiding**, and **three exit modes** (Fixed TP/SL, Trailing, Trailing+TP) with built-in risk caps. Three one-click presets—**Balanced / Trend / Scalper**—cover different regimes and risk appetites.
> Instruments: futures / continuous contract
> Direction: **Long-only** (this script version)
> Timeframe: **30m** (toggleable)
---
## Entry
* **Trigger:** `MACD` line crossing **above** `Signal`.
* **Trend filter (optional):** price above `EMA(p_emaLen)` and `MACD > 0 & Signal > 0`.
* **Timeframe guard:** by default, signals are valid on **30m** only.
## Exit
* **Fixed TP/SL:** percentage-based limit and stop.
* **Trailing:** ATR-based trailing offset (or percent).
* **Trailing + TP:** trailing stop **and** a take-profit cap.
* **Protective flip:** when `MACD` crosses **below** `Signal`, close the long.
> Choose exit mode in **Inputs → “Exit Mode”**:
> `Auto(by preset) / Fixed TP/SL / Trailing / Trailing + TP`.
---
## Pyramiding (optional)
* Adds only **against adverse pullbacks** from the last add price.
* Up to `p_maxAdds` layers; each layer triggers at `p_addStep%` pullback from the **previous add**.
* Goal: **improve average price** with **small steps & limited layers** to keep drawdowns controlled.
---
## Risk Management
* **Daily loss cap:** `strategy.risk.max_intraday_loss(p_maxDailyDD, % of equity)`.
* **Per-trade size cap:** `strategy.risk.max_position_size(p_posCapPct)`.
* **Order size (strategy properties):** default **90% of equity** (for display).
* Practical suggestion: Balanced ≈ **40%**, Trend ≈ **35%**, Scalper ≈ **30%** (set in Strategy Properties → Order size).
---
## Presets (one-click)
| Preset | MACD (fast/slow/signal) | Trend EMA | Pyramiding | Add Step | Fixed TP/SL (%) | Trailing (ATR) | Pos Cap | Daily DD |
| ---------------------- | ----------------------- | --------- | ---------- | -------- | ------------------------- | -------------- | ------- | -------- |
| **Balanced (default)** | 8 / 21 / 5 | 233 | 2 layers | 0.12% | TP **0.22** / SL **0.15** | **1.2×** | **50%** | **1.5%** |
| **Trend** | 10 / 24 / 7 | 200 | 3 layers | 0.10% | TP **0.25** / SL **0.18** | **1.6×** | **45%** | **1.2%** |
| **Scalper** | 6 / 19 / 4 | 100 | Off | — | TP **0.18** / SL **0.12** | **1.3×** | **35%** | **1.0%** |
> **Balanced:** all-weather, stable.
> **Trend:** holds longer and targets higher R multiples.
> **Scalper:** quick in/out, higher hit-rate, no stacking.
---
## Usage Tips
1. **Symbol/TF:** `CME_MINI:NQ1!`, **30m**.
2. **Fees:** default **\$1 per contract** (adjust to your broker in Strategy Properties).
3. **Execution realism:** enable **Bar Magnifier** (Strategy Properties → Advanced) for more accurate limit/trailing fills.
4. **Sizing:** the script defaults to 90% only to showcase behavior—use **30–40%** in realistic tests.
5. **Pyramiding:** keep layers small & capped. In choppy regimes, reduce `p_posCapPct` and `p_maxDailyDD`.
---
## Inputs (right-panel)
* **Param Preset:** `Balanced / Trend / Scalper`
* **30m-only:** on/off
* **Exit Mode:** `Auto(by preset) / Fixed TP/SL / Trailing / Trailing + TP`
> All other parameters are pre-wired by the chosen preset for **plug-and-play** operation.
---
## Notes & Disclaimer
* Educational use only—**not** financial advice. Futures and leverage carry substantial risk.
* Presets reflect historical characteristics; **future performance is not guaranteed**. Start small or paper trade first.
* This version is **long-only**; if you need a two-sided (long & short) variant or extras (RTH/HTF filters), leave a comment.
---
**Author Notes**
* Written in **Pine v6** with common pitfalls avoided (e.g., `strategy.risk.max_position_size()` takes **one** arg, `plot` titles are **const strings**, trailing requires `trail_price + trail_offset`).
* Share your backtest screenshots (period, fees, order size) and I can suggest **tighter, data-driven knobs** for your setup.

Delta Drift Allocator - StrategySummary
Bar-close, drift-based allocation alerts that keep exposure centered around a user-set base with full compounding by default. One alert per bar close. Non-repainting. Invite-Only.
Description
Delta Drift Allocator monitors how far current exposure drifts from a reference profile. When drift exceeds your threshold, it issues a single bar-close instruction (BUY/SELL with quantity) to nudge exposure back toward center. The emphasis is path discipline—rules that react to swings without predicting direction—plus a simple one-alert workflow.
A start-sync input lets you align the script with your actual initial fill so subsequent sizes match your account. Profit handling supports Reinvest (compound) or Skim to base (bookkeep excess).
How to use (overview)
Add to chart (recommended timeframe: 4h).
Set Inputs: drift threshold, min notional, start method (Auto or Manual sync at your bar-close time + filled units).
Create one alert: This strategy → Any alert() function call, Once per bar close. Leave Message empty.
Execute externally: place BUY/SELL for exactly the shown qty (manual or your own webhook executor outside TradingView).
Note: A detailled manual is provided after purchase.
Why traders choose it
Bar-close discipline (no intra-bar churn, non-repainting)
Drift-responsive adjustments that can harvest parts of oscillations
Full compounding by default; optional “skim to base” bookkeeping
Start-sync to match real fills; minimal panel plots you can hide
Access (Invite-Only)
To request access, send me a PM on TradingView. You’ll receive detailled information about the process.
Note: Requests for older strategies are no longer processed—please refer to this release only.
Compliance
Signals only; the script does not place orders or read balances. Backtests are approximations and are not indicative of future results. Markets involve risk, including possible loss. Extended one-way advances can lag all-in exposure; starting right after strong rallies may show initial drawdowns.
Maiko Range Scalper (Sideways BB + RSI) – v4 cleanPurpose
It’s a range scalping strategy for crypto. It tries to take small, repeatable trades inside a sideways market: buy near the bottom of the range, sell near the middle/top (and the reverse for shorts).
Core idea (two timeframes)
Define the trading range on a higher timeframe (HTF)
You choose the HTF (e.g., 15m or 1h).
The script finds the highest high and lowest low over a lookback window (e.g., last 96 HTF candles) → these become HTF Resistance and HTF Support.
It also calculates the midline (average of support/resistance).
Trade signals on your lower timeframe (LTF)
You run the strategy on a fast chart (e.g., 1m or 5m).
Entries are only allowed inside the HTF range.
Entry logic (mean reversion)
Indicators on the LTF:
Bollinger Bands (length & std dev configurable).
RSI (length & thresholds configurable).
Optional VWAP proximity filter (price must be within X% of VWAP).
Long setup:
Price touches/under-cuts the lower Bollinger band AND RSI ≤ threshold (default 30) AND price is inside the HTF range (and passes VWAP filter if enabled).
Short setup:
Price touches/exceeds the upper Bollinger band AND RSI ≥ threshold (default 70) AND price is inside the HTF range (and passes VWAP filter if enabled).
Exits and risk
Stop-loss: placed just outside the HTF range with a configurable buffer %:
Long SL = HTF Support × (1 − buffer).
Short SL = HTF Resistance × (1 + buffer).
Take-profit (selectable):
Mid band (the Bollinger basis) → conservative, faster exits.
Opposite band / HTF boundary → more aggressive, higher RR but more give-backs.
Position sizing
A simple cap: maximum position size = percent of account equity (e.g., 20%).
The script calculates quantity from that cap and current price.
Plots you’ll see on the chart
HTF Resistance (red) and HTF Support (green) via plot().
HTF Midline (gray dashed) drawn with a line.new() object (because plot() cannot do dashed).
Bollinger basis/upper/lower on the LTF.
Optional VWAP line (only shown if you enable the filter).
Signal markers (green triangle up for Long setups, red triangle down for Short setups).
Alerts
Two alertconditions:
“Long Setup” – when a long entry condition appears.
“Short Setup” – when a short entry condition appears.
Create alerts from these to get notified in real time.
How to use it (quick start)
Add to a 1m or 5m chart of a liquid coin (BTC, ETH, SOL).
Set HTF timeframe (start with 1h) and lookback (e.g., 96 = ~4 days on 1h).
Keep default Bollinger/RSI first; tune later.
Choose TP mode:
“Mid band” for quick scalps.
“Opposite band/Range” if the range is very clean and you want bigger targets.
Set SL buffer (0.15–0.30% is common; adjust for volatility).
Set Max position % to control size (e.g., 20%).
(Optional) Enable VWAP filter to skip stretched moves.
When it works best
Clearly sideways markets with visible support/resistance on the HTF.
High-liquidity pairs where spreads/fees are small relative to your scalp target.
Limitations & safety notes
True breakouts will invalidate mean-reversion logic—your SL outside the range is there to cut losses fast.
Fees can eat into small scalps—prefer limit orders, rebates, and liquid pairs.
Backtest results vary by exchange data; always forward-test on small size.
If you want, I can:
Add an ATR-based stop/target option.
Provide a study-only version (signals/alerts, no trading engine).
Pre-set risk to your €5,000 plan (e.g., ~0.5% max loss/trade) with calculated qty.

EMA inFusion Pro - Multiple SourcesEMA Fusion Pro: Dynamic Trend & Momentum Strategy with Three Exit Modes
EMA Fusion Pro is a highly customizable, multi-exit trend-following strategy designed for traders who value both precision and flexibility. By leveraging exponential moving averages (EMA), average directional index (ADX), and volume analysis, this strategy aims to capture trending market moves while offering three distinct exit modes for optimal risk management across varying market conditions.
Strategy Overview
This strategy systematically identifies potential entry points using a moving average crossover with highly configurable data sources (including price, volume, rate of change, or their Heikin Ashi versions) and filters signal quality with ADX trend strength and volume spikes. Each trade is managed with one of three advanced exit methodologies—reverse signal, ATR-based stop/take profit, or fixed percentage—giving you the control to adapt your risk profile to different market regimes.
Key Features
Customizable EMA Source: Calculate the core trend-filtering EMA from price (default), volume, rate of change, or their Heikin Ashi counterparts for unique market perspectives.
Trend Filter with ADX: Confirm entries only when the trend is strong, as measured by the user-adjustable ADX threshold.
Volume Spike Confirmation: Optional filter to only take trades with above-average volume activity, reducing false signals.
Three Exit Modes:
Reverse Signal: Exit trades when a new, opposite entry signal occurs.
ATR-Based Stop/Take Profit: Dynamic risk management using multiples of the average true range (ATR) for both take profit and stop loss.
Percent-Based Stop/Take Profit: Fixed-percentage risk management with user-defined thresholds.
Visual Annotations: Signal markers, EMA line color-coded by source, trend background coloring, and optional ATR/percent-based TP/SL levels.
Info Panel: Real-time display of all core indicators, current trading mode, exit parameters, and position status for quick oversight.
How It Works
Entry Logic: A crossover signal (above/below the EMA) triggers a new entry, but only if both ADX trend strength and (optionally) volume spike conditions are met.
Exit Logic: Three selectable modes allow you to exit trades on reverse signals, at a dynamic ATR-based profit or loss, or at a fixed percentage gain/loss.
Flexible Data Analysis: The EMA source can be chosen from six options—standard price, volume, rate of change, or their Heikin Ashi variants—allowing experimentation with different market dimensions.
Risk Management: All exits are precisely controlled, either by the next opposing signal, by volatility-adjusted levels, or by fixed risk/reward ratios.
Backtest & Optimization: The strategy is fully backtestable within TradingView’s Strategy Tester, with adjustable parameters for optimization.
Customization & Usage
Indicator Source: Select your preferred data type for EMA calculation, opening the door to creative strategy variations (e.g., volume momentum, pure price trend, rate of change divergence).
Filter Toggles: Enable/disable ADX and volume filters as desired—useful for different market environments.
Exit Mode Selection: Switch between reverse, ATR, or percent-based exits with a single parameter—ideal for adapting to ranging vs. trending markets.
Visual Clarity: The EMA line color reflects its underlying source, and the info panel summarizes all critical values for easy monitoring.
Who Should Use This Strategy?
Trend Followers seeking to ride strong moves with multiple exit options.
Experienced Traders who want to experiment with different data types (volume, momentum, Heikin Ashi) for trend analysis.
Algorithmic Traders looking for a robust, flexible base to build upon with their own ideas.
Getting Started
Apply the script to your chart and review default settings.
Customize parameters—EMA length, ADX threshold, volume settings, exit type—as desired.
Backtest on multiple instruments and timeframes to evaluate performance.
Optimize filters, exit rules, and risk parameters for your preferred trading style.
Monitor with the real-time info panel and trade alerts.
Disclaimer
This script is for educational and entertainment purposes only. It is not financial advice. Past performance is not indicative of future results. Always conduct thorough testing and consider your risk tolerance before trading real capital.
— Happy Trading —
Feel free to adapt, share, and contribute to this open-source strategy!

Ifvgs with Targets
This strategy identifies inversion fair value gaps on the 1-5 minute timeframe that occur with a 5 or 15 minute unfilled fair value gap existing in the direction of the trade.
The script marks out the 5 and 15 minute unfilled gap targets with red and green lines.
The script also calculates how many contracts to enter based on the risk and dollar per point value that you set in the settings.
Trades are triggered upon a candle closure that inverses the fair value gap. When a trade is triggered, a bold red line is drawn at the suggested stop loss (low of the body of the gap), and a bold green line is drawn at the price level that is a 1R distance from the entry.
This strategy will only run on the 1-5 minute timeframes, and is designed specifically for Nasdaq futures (NQ or MNQ).
The suggested way to use this indicator is by adding alerts to be notified when an IFVG occurs.
Add alerts by going to the three dots next to the indicator, selecting "Add alert", and then setting the condition to "alert() function calls only". This will alert you on potential trades before the trade actually triggers on the candle closure, so you have time to look at the setup before the entry.
Do not follow this indicator blindly, always do your own analysis and use this as a tool.

The Barking Rat LiteMomentum & FVG Reversion Strategy
The Barking Rat Lite is a disciplined, short-term mean-reversion strategy that combines RSI momentum filtering, EMA bands, and Fair Value Gap (FVG) detection to identify short-term reversal points. Designed for practical use on volatile markets, it focuses on precise entries and ATR-based take profit management to balance opportunity and risk.
Core Concept
This strategy seeks potential reversals when short-term price action shows exhaustion outside an EMA band, confirmed by momentum and FVG signals:
EMA Bands:
Parameters used: A 20-period EMA (fast) and 100-period EMA (slow).
Why chosen:
- The 20 EMA is sensitive to short-term moves and reflects immediate momentum.
- The 100 EMA provides a slower, structural anchor.
When price trades outside both bands, it often signals overextension relative to both short-term and medium-term trends.
Application in strategy:
- Long entries are only considered when price dips below both EMAs, identifying potential undervaluation.
- Short entries are only considered when price rises above both EMAs, identifying potential overvaluation.
This dual-band filter avoids counter-trend signals that would occur if only a single EMA was used, making entries more selective..
Fair Value Gap Detection (FVG):
Parameters used: The script checks for dislocations using a 12-bar lookback (i.e. comparing current highs/lows with values 12 candles back).
Why chosen:
- A 12-bar displacement highlights significant inefficiencies in price structure while filtering out micro-gaps that appear every few bars in high-volatility markets.
- By aligning FVG signals with candle direction (bullish = close > open, bearish = close < open), the strategy avoids random gaps and instead targets ones that suggest exhaustion.
Application in strategy:
- Bullish FVGs form when earlier lows sit above current highs, hinting at downward over-extension.
- Bearish FVGs form when earlier highs sit below current lows, hinting at upward over-extension.
This gives the strategy a structural filter beyond simple oscillators, ensuring signals have price-dislocation context.
RSI Momentum Filter:
Parameters used: 14-period RSI with thresholds of 80 (overbought) and 20 (oversold).
Why chosen:
- RSI(14) is a widely recognized momentum measure that balances responsiveness with stability.
- The thresholds are intentionally extreme (80/20 vs. the more common 70/30), so the strategy only engages at genuine exhaustion points rather than frequent minor corrections.
Application in strategy:
- Longs trigger when RSI < 20, suggesting oversold exhaustion.
- Shorts trigger when RSI > 80, suggesting overbought exhaustion.
This ensures entries are not just technically valid but also backed by momentum extremes, raising conviction.
ATR-Based Take Profit:
Parameters used: 14-period ATR, with a default multiplier of 4.
Why chosen:
- ATR(14) reflects the prevailing volatility environment without reacting too much to outliers.
- A multiplier of 4 is a pragmatic compromise: wide enough to let trades breathe in volatile conditions, but tight enough to enforce disciplined exits before mean reversion fades.
Application in strategy:
- At entry, a fixed target is set = Entry Price ± (ATR × 4).
- This target scales automatically with volatility: narrower in calm periods, wider in explosive markets.
By avoiding discretionary exits, the system maintains rule-based discipline.
Visual Signals on Chart
Blue “▲” below candle: Potential long entry
Orange/Yellow “▼” above candle: Potential short entry
Green “✔️”: Trade closed at ATR take profit
Blue (20 EMA) & Orange (100 EMA) lines: Dynamic channel reference
⚙️Strategy report properties
Position size: 25% equity per trade
Initial capital: 10,000.00 USDT
Pyramiding: 10 entries per direction
Slippage: 2 ticks
Commission: 0.055% per side
Backtest timeframe: 1-minute
Backtest instrument: HYPEUSDT
Backtesting range: Jul 28, 2025 — Aug 17, 2025
Note on Sample Size:
You’ll notice the report displays fewer than the ideal 100 trades in the strategy report above. This is intentional. The goal of the script is to isolate high-quality, short-term reversal opportunities while filtering out low-conviction setups. This means that the Barking Rat Lite strategy is very selective, filtering out over 90% of market noise. The brief timeframe shown in the strategy report here illustrates its filtering logic over a short window — not its full capabilities. As a result, even on lower timeframes like the 1-minute chart, signals are deliberately sparse — each one must pass all criteria before triggering.
For a larger dataset:
Once the strategy is applied to your chart, users are encouraged to expand the lookback range or apply the strategy to other volatile pairs to view a full sample.
💡Why 25% Equity Per Trade?
While it's always best to size positions based on personal risk tolerance, we defaulted to 25% equity per trade in the backtesting data — and here’s why:
Backtests using this sizing show manageable drawdowns even under volatile periods.
The strategy generates a sizeable number of trades, reducing reliance on a single outcome.
Combined with conservative filters, the 25% setting offers a balance between aggression and control.
Users are strongly encouraged to customize this to suit their risk profile.
What makes Barking Rat Lite valuable
Combines multiple layers of confirmation: EMA bands + FVG + RSI
Adaptive to volatility: ATR-based exits scale with market conditions
Clear, actionable visuals: Easy to monitor and manage trades

The Barking Rat ReversionsMean Reversion with Multi-Layered Precision
The Barking Rat Reversions is a short-term mean reversion strategy tailored for high-volatility markets. It combines several well-established technical tools in a configuration to identify overextended price movements likely to revert toward equilibrium. The goal is to isolate high-quality, short-term reversal opportunities while filtering out low-conviction setups.
At its core, our strategy triggers off Fair Value Gaps (FVGs) that occur a considerable distance away from a dynamically defined equilibrium band. It then validates these gaps by checking proximity to recent support and resistance drawn from swing extremes.
Additional confirmation comes from momentum filters and wick-rejection patterns, ensuring each entry aligns with both price structure and stretched momentum. Exits use volatility-adjusted profit targets. Keeping the approach disciplined and adaptive.
🧠Core Logic: Selectivity & Structure
This strategy is intentionally very selective. We have designed it to filter out roughly 95% of all market noise, highlighting only setups that pass multiple validation layers outlined below.
Fair Value Gaps (FVGs) as the Primary Trigger
FVGs identify imbalance zones where price historically retraces. These inefficient zones often become magnets for reversion as the market seeks to rebalance.
Dynamic Equilibrium Band + S/R
Defines a fair value zone with a long-term moving average and combines it with shorter-term swing pivots to establish support/resistance. Only FVGs that occur outside the band and near recent pivots are considered, ensuring reversals are sufficiently distanced and not taken too close to the mean.
Proximity to Support/Resistance
Setup validity depends on location. The strategy filters for FVGs near well-defined structural levels — areas where price has previously turned (i.e., recent swing highs or lows). This increases the likelihood that reversals are occurring at legitimate zones of confluence.
Wick-Rejection Confirmation
Confirms potential exhaustion through characteristic candle wick patterns beyond the equilibrium region. This acts as another filter to improve signal accuracy.
Sequential Filtered Signals
Custom logic ensures that a new signal in any direction must improve upon the previous one, preventing repetitive or suboptimal entries.
Multi-Step Confirmation
All validation layers must coincide on the same bar before a signal triggers, dramatically reducing false positives.
📈Chart Visuals: Designed for Clarity
To ensure transparency and easy interpretation, the script overlays intuitive visuals:
Green “▲” below a candle: Indicates a potential long entry
Red “▼” above a candle: Indicates a potential short entry
Green “✔️”: Marks exit from a trade when ATR target is met
Background shading (green/red): Indicates trade direction while active
Support/Resistance lines: Auto-plotted from recent swing levels
🔔Alerts: Stay Notified Without Watching
The strategy supports real-time alerts on candle close, ensuring that signals are only triggered once fully confirmed.
You must manually set up alerts within your TradingView account. Once configured, you’ll be able to set up one alert per instrument. This one alert covers all relevant signals and exits — ideal for hands-free monitoring.
⚙️Strategy report properties
Position size: 25% equity per trade
Initial capital: 10,000.00 USDT
Pyramiding: 10 entries per direction
Slippage: 2 ticks
Commission: 0.055% per side
Backtest timeframe: 1-minute
Backtest instrument: HYPEUSDT
Backtesting range: Jul 21, 2025 — Aug 7, 2025
Note on Sample Size:
You’ll notice the report displays fewer than the ideal 100 trades in the strategy report above. This is intentional. The goal of the script is to isolate high-quality, short-term reversal opportunities while filtering out low-conviction setups. This means that the Barking Rat Reversions strategy is ultra-selective, filtering out over 95% of market noise by enforcing multiple validation layers. The brief timeframe shown in the strategy report here illustrates its filtering logic over a short window — not its full capabilities. As a result, even on lower timeframes like the 1-minute chart, signals are deliberately sparse — each one must pass all criteria before triggering.
We conducted a broader backtest covering the period from December 5, 2024 to July 31, 2025, during which the strategy identified 968 high-probability setups on the same instrument and timeframe as the strategy report.
For a larger dataset:
Once the strategy is applied to your chart, users are encouraged to expand the lookback range or apply the strategy to other volatile pairs to view a full sample.
💡Why 25% Equity Per Trade?
While it's always best to size positions based on personal risk tolerance, we defaulted to 25% equity per trade in the backtesting data — and here’s why:
Backtests using this sizing show manageable drawdowns even under volatile periods
The strategy generates a sizeable number of trades, reducing reliance on a single outcome
Combined with conservative filters, the 25% setting offers a balance between aggression and control
Users are strongly encouraged to customize this to suit their risk profile.
🔍What Makes This Strategy Unique?
Multi-factor confirmation using FVGs, EMA deviation, RSI, wick rejection, and S/R
Clean, Intuitive Chart Experience
Real-time alerts triggered only on confirmation
Variables monitor prior reversal points, guaranteeing each new signal offers an improved entry
Tracks active positions and resets filters upon exit.
